 |
newAD2gui – Evolution
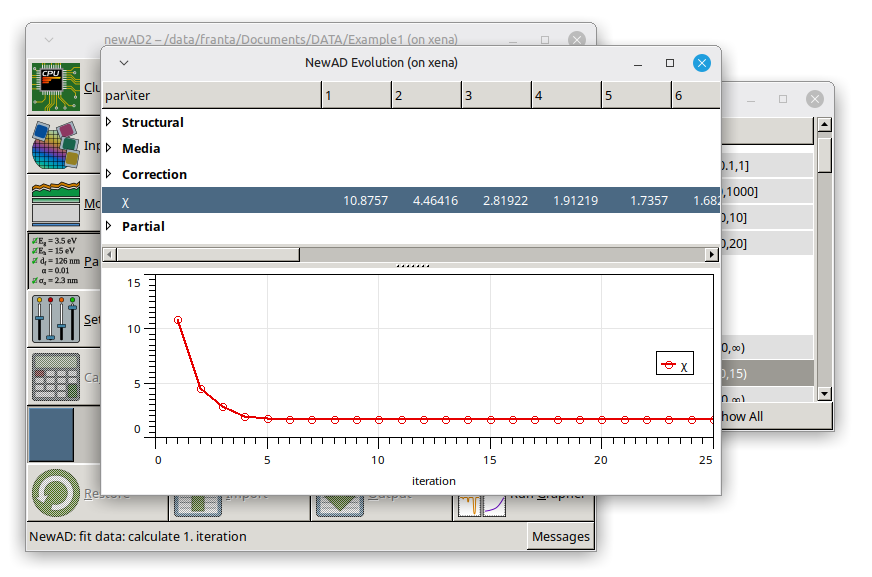
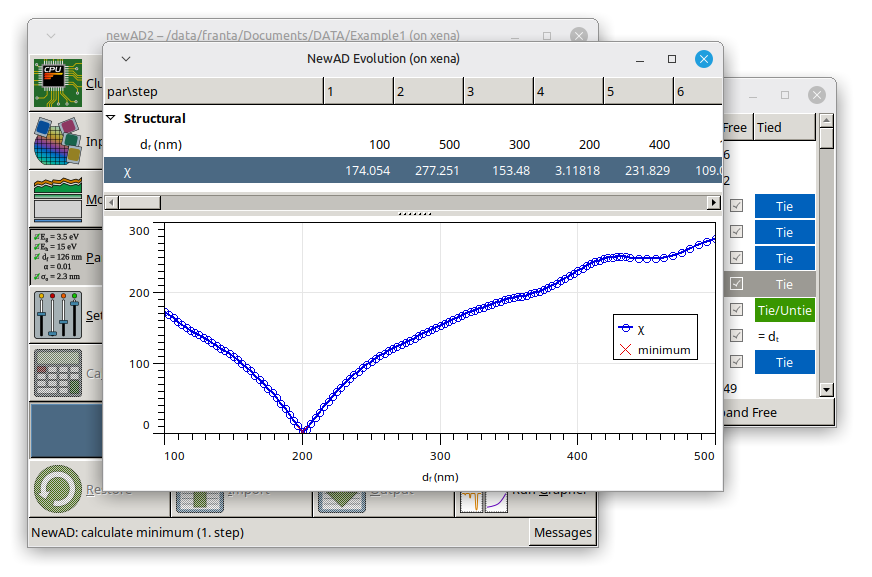
The window with a table and a graph of the evolution of χ and the free parameter values across the fit iterations (or across the individual steps when searching for a minimum). The table has the free parameters grouped as a tree – and, when fitting more than one data set, also the partial χ values for the individual data sets – which need to be expanded; the overall χ is in a row below them and is always shown. Columns correspond to individual iterations (numbered from 1). Clicking a row in the table shows its course as a function of iteration in the graph below (for a minimum search the graph instead always shows χ as a function of the scanned parameter, with the current best minimum marked). The window keeps updating automatically while a calculation is running.