 |
newAD2gui – graphical frontend
The command newAD2gui launches the graphically oriented frontend of the program. If newAD2 is not running yet, a dialog window first appears in which the working directory is chosen; it cannot be changed while the program is running. Just like text consoles, any number of graphical interfaces can be run at the same time – even against the same running newAD2 (the working directory is therefore always shown in the window title, so the individual windows can be told apart).
The main window consists of vertically arranged rows. Most rows combine a toggle button that opens a separate window with details, and a brief summary of the current status next to it. Pressing the same button again (or closing the window) merely hides an open window, it is never destroyed – for the whole lifetime of the program it therefore remembers its screen position and size, even after being closed and reopened. The availability of the individual buttons and windows changes automatically depending on whether the program is currently idle or a calculation (fit, minimum search, table, etc.) is running – for example, editing the model, parameters or settings is only possible while idle.
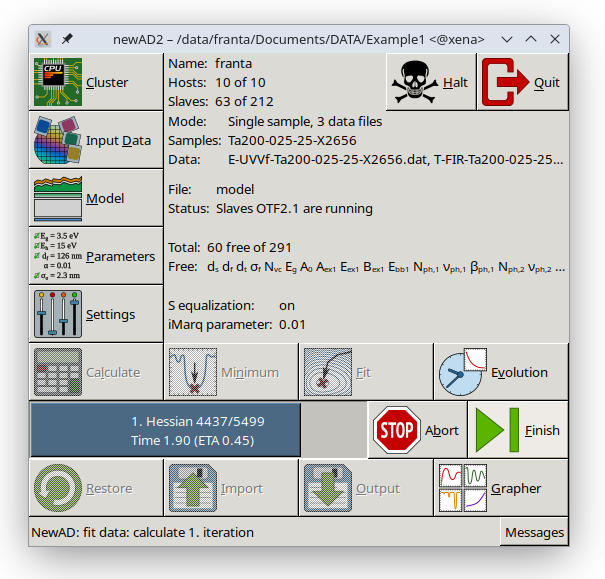
Rows of the main window
-
Cluster – opens the cluster management window (see below); next to the button is a summary (cluster name, number of added computers, number of awake computing processes). This row also has the Halt and Quit buttons – easy to confuse, but they do very different things: Halt terminates the entire running backend (the
masterAD2process together with the whole cluster), while Quit only closes this graphical window – the backend keeps running in the background and can be reconnected to later (just as via the text console). - Input Data – opens the sample and input-data selection dialog (see below); the summary next to the button shows the current mode (single-sample/multisample), sample names and the names of the loaded quantities.
- Model – opens the model window (see below); the summary shows the file the model was loaded from (or None if none), and the name of the computing process (slave) that evaluates it.
- Parameters – opens the model parameters window (see below); the summary shows the total and free parameter counts and their names.
-
Settings – opens the fitting-algorithm settings window (see below); the summary shows the
S equalizationstate and theiMarqparameter value. -
Calculate, Minimum, Fit, Evolution – the row with the main fitting actions. Calculate computes theoretical values for the current parameters (equivalent to the text-mode
calculatecommand). Minimum opens the window for finding the minimum of the sum of squares for one selected parameter (see below) – it is only available when a specific parameter is selected in the Parameters window. Fit starts fitting the free parameters. Evolution opens the window showing the evolution of χ and parameter values during fitting/minimum search (see below). -
Abort, Finish – the row with the calculation progress bar. Finish stops the running calculation once the current iteration completes (equivalent to the text-mode
endcommand). Abort interrupts the calculation immediately without waiting for the iteration to finish – the parameter values are restored to their state before the calculation started. -
Restore, Import, Output, Run Grapher – Restore resumes an interrupted calculation (available only if a restore file exists on disk). Import opens the window for loading a previously saved
.outor.logfile (see below). Output saves the current result to a file. Run Grapher launches the grapherAD2 program for graphical display of the data. - Messages – the last row shows the single most recent message from the backend (error messages in red); the Messages button opens a window with the complete, scrollable log of all messages since startup.